Skip to Main Content
Banner Image Return to SJF Lavery Library Homepage Return to Lavery Library Research Guides Homepage

Infographics and Visual Communication

Need to communicate an idea through an onslaught of data? An infographic might be the way to go.

What's an Infographic?

Infographics are "graphic visual representations of information, data or knowledge intended to present information quickly and clearly." (Wikipedia).

Infographics include a lot of things, from individual charts, plots, and maps to presentations that combine these data visualizations with additional visuals and language to tell a story.
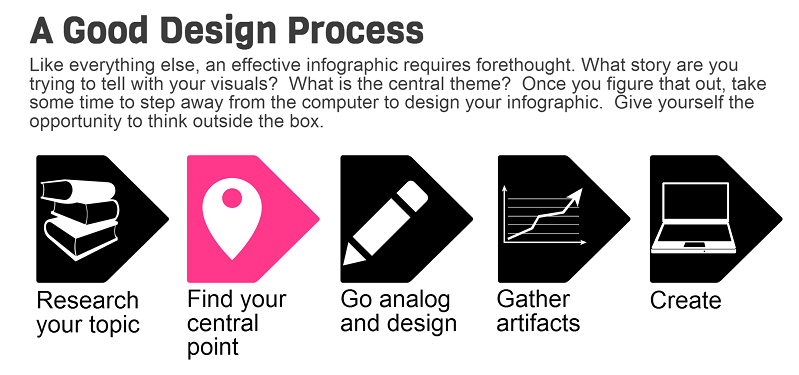
Tools for Creating Infographics

Designing Infographics

Layout

Infographics should be laid out in such a way that important data points are highlighted, explained briefly, and flow into the next visual element.

Remember these guidelines:

  • Space out elements to keep the design less cluttered (remember to leave "whitespace")
  • Use only essential text; keep it visual!

Know your Limits

  • Limit your color palette to a few key colors
  • Limit your use of fonts to a few, and keep them consistent for text of the same type (e.g., headings and body text)

Ideas

  • Style up your graphs to communicate visually -- why is your pie chart not a pie?

PowerPoint Tips

Here's a selection of very important functions in Powerpoint for designing posters and infographics.

  • Insert Menu has almost anything you could need:
    • Text Box
      Insert these to add your text, obviously.
    • Shapes
      Your bread and butter. Make circles and rectangles behind your text to pop it out from the background and provide organized sections.
    • Smart Art
      LOTS of diagrams and visualizations -- get your point across without reinventing the wheel
    • Pictures
      Load a picture you took, or one you found
    • Online Pictures
      Search for pictures that are licensed for reuse through Creative Commons
  • Design Menu:
    • Format Background to change up the background colors. Use gradients to go from light to dark
    • Choose a Variant to select a color theme
  • Drawing Tools Menu appears after you've inserted a shape and selected it with your mouse:
    • Send Backward/Forward
      Control what displays in front of something else
    • Rotate
      Spin or flip something you've inserted
    • Shape Fill
      The color inside a shape
    • Shape Outline
      The color and width (or weight) of the shape border (or, if it's a line, the color of the line)